
Record Event Data
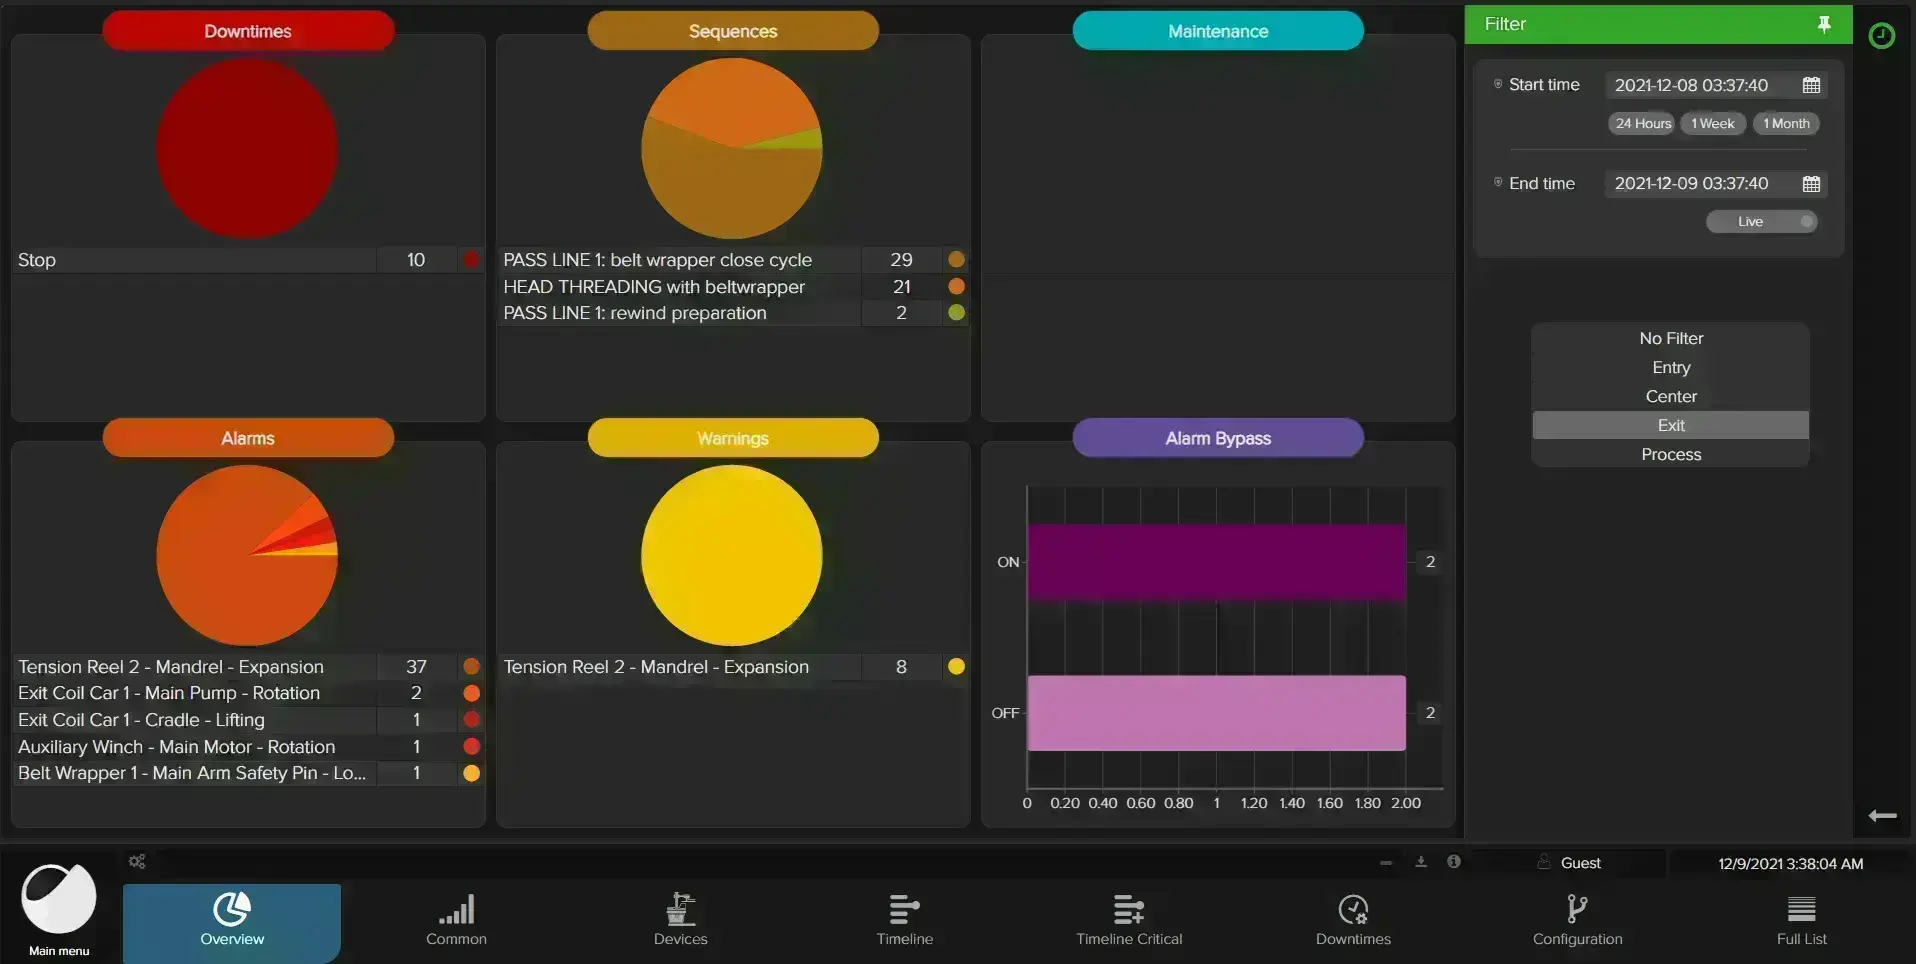
Record Event Data (RED) processes data sets that include telemetry and events generated from multiple plant data sources. It provides a very intuitive overview of the plant: active anomalies, conditions that are in a degenerative trend and could generate failures, and rapid support for diagnosing the causes of downtime.
Overview
RED is an application developed by Tenova to process datasets that include analog values (telemetry data) and Boolean events and states.
The main purpose of this tool is to provide in an intuitive overview of the plant status: active anomalies, conditions that are in a degenerative trend and that could generate failures and a quick support to diagnose the causes of downtime. The target is to provide a monitor tool integrated on the 4.0 pulpit to provide the operator and the maintenance technician an immediate feedback on the anomalous behavior of the machines and sequences.
Tenova will also be able to provide analysis and verification services in support of maintenance technicians with the aim of providing useful information to reduce downtime and suggest optimizations in line operating procedures, thus improving the quality of the final product.
The application can work with on-line data or stored data:
- Off-Line mode: recorded events that occurred in a desired time frame supported by telemetry data from heterogeneous sources;
- On-Line mode: provides an immediate feedback on anomalous machines and sequence behavior;
RED offers different interaction modes and functionalities, which can be customized according to the level of operator who is consulting the information.
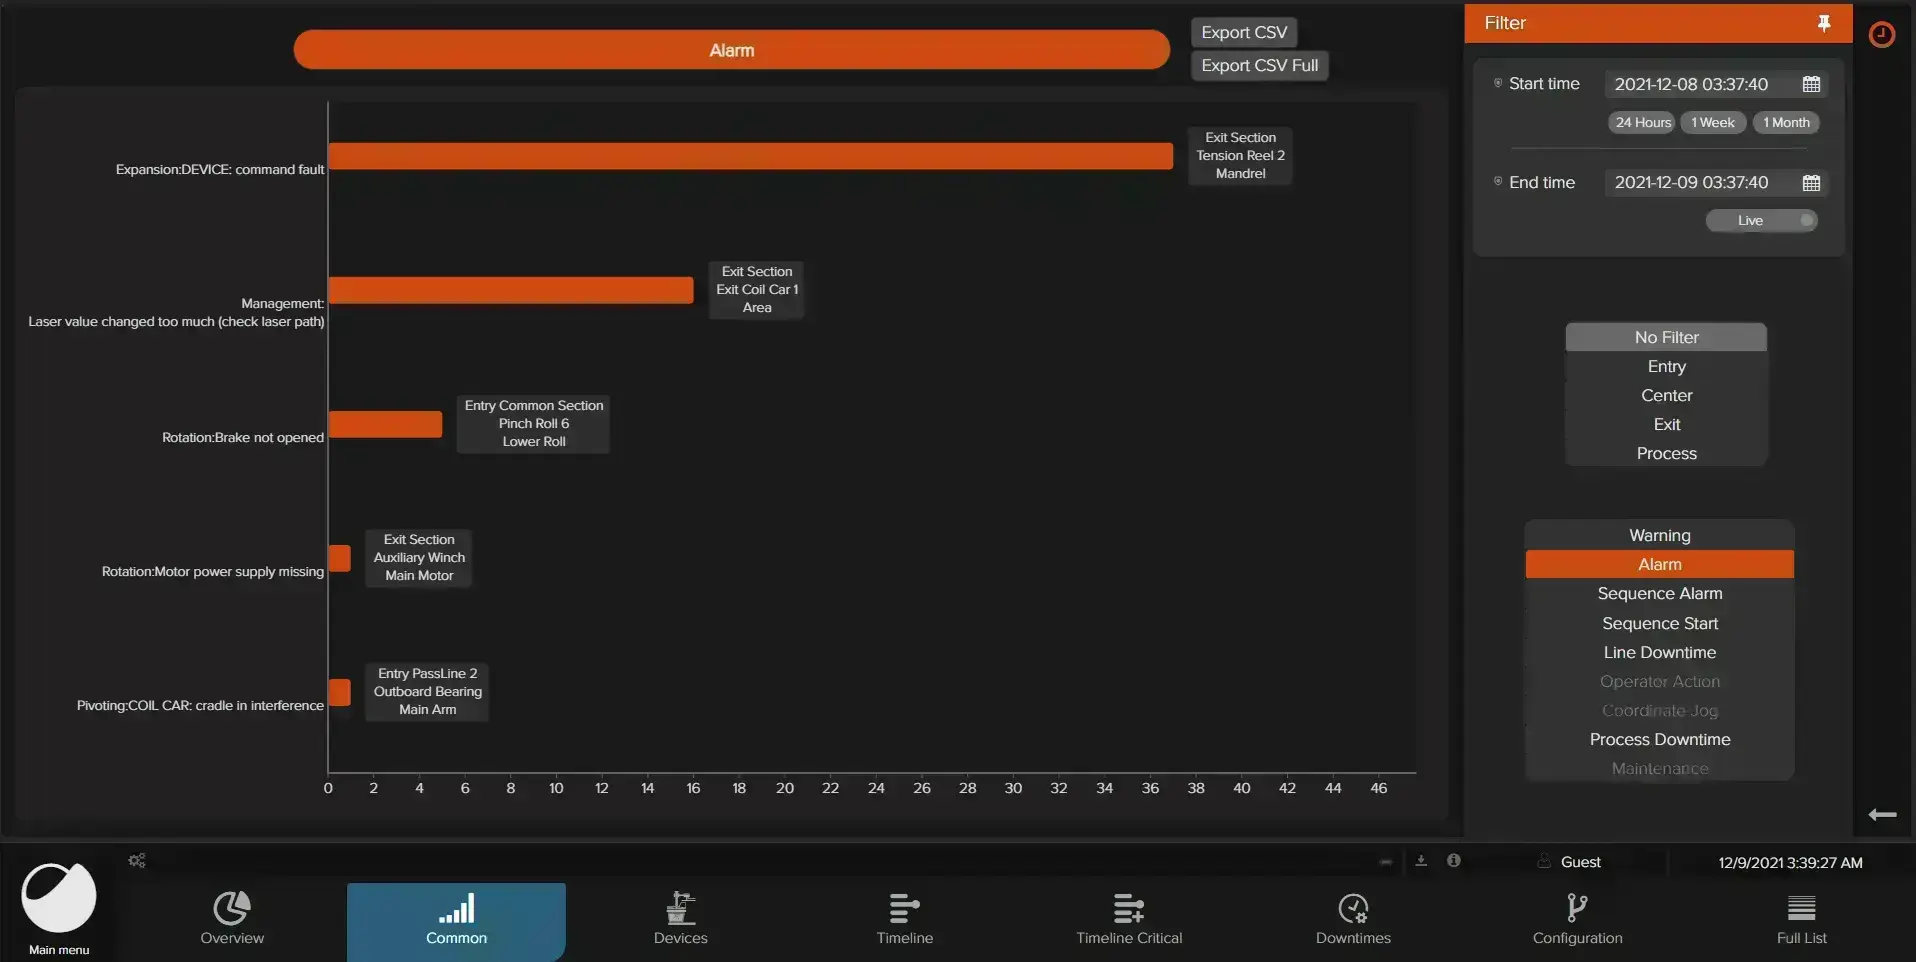
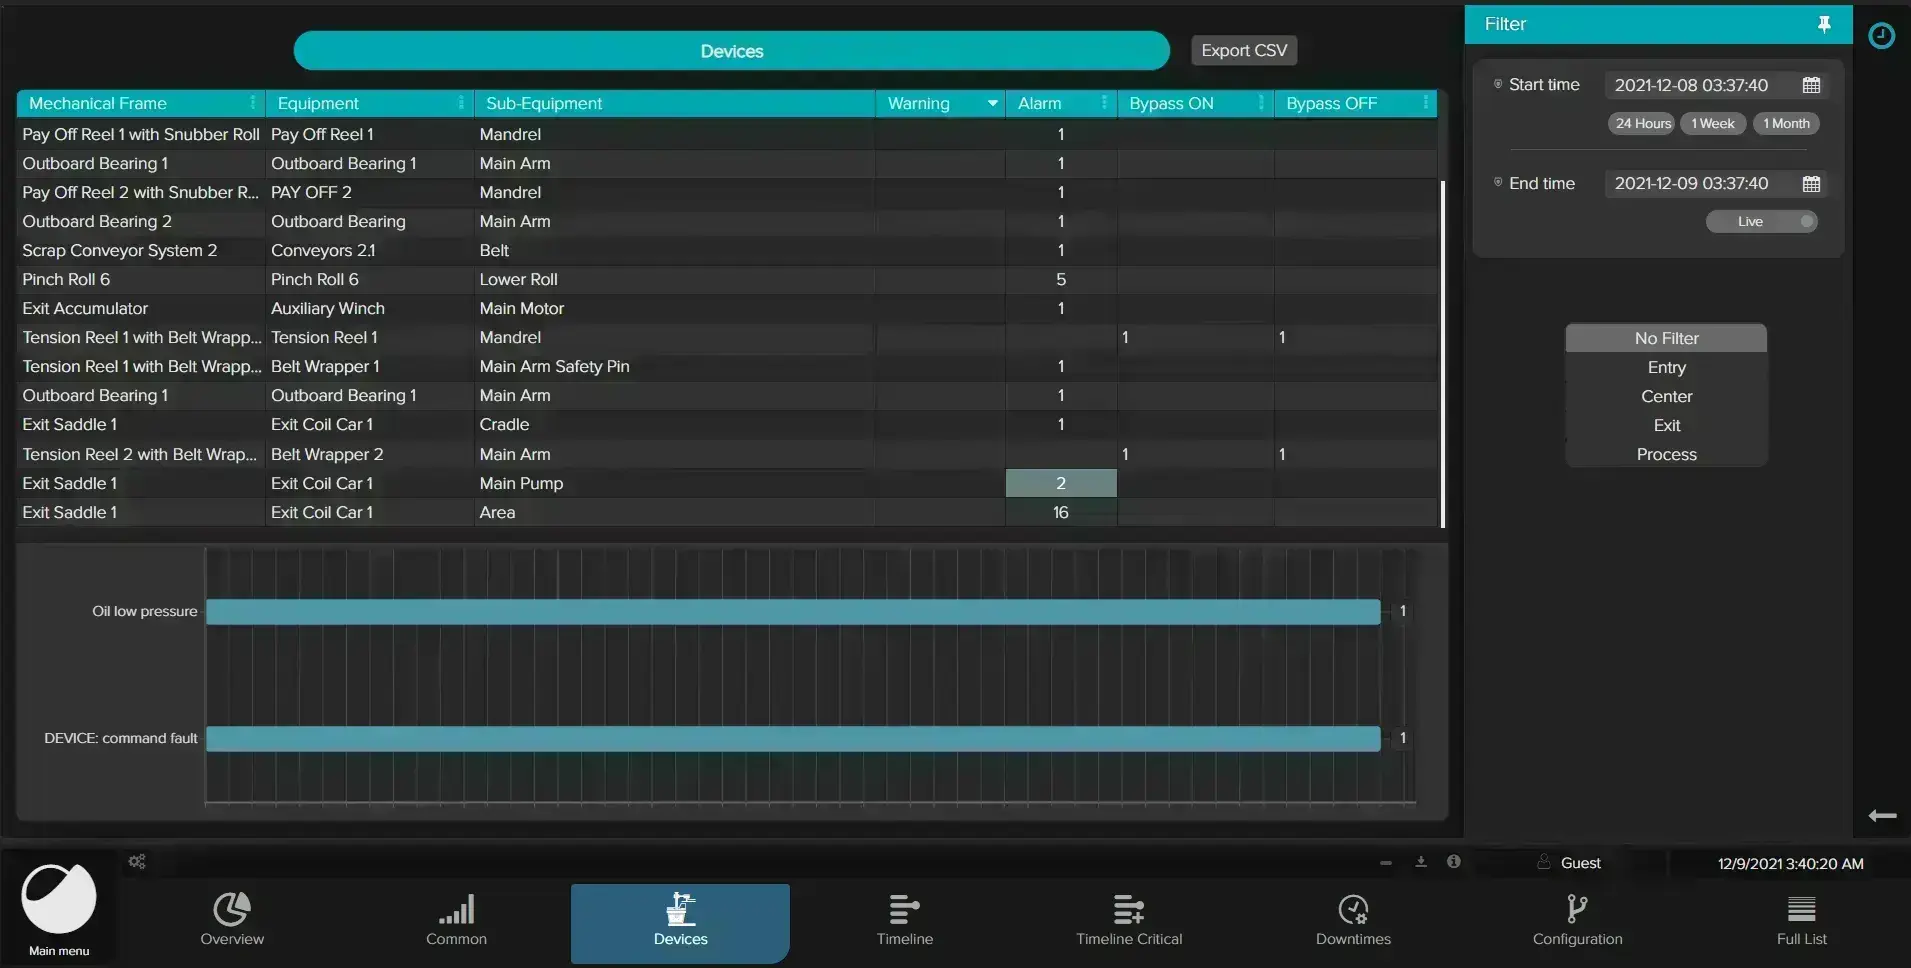
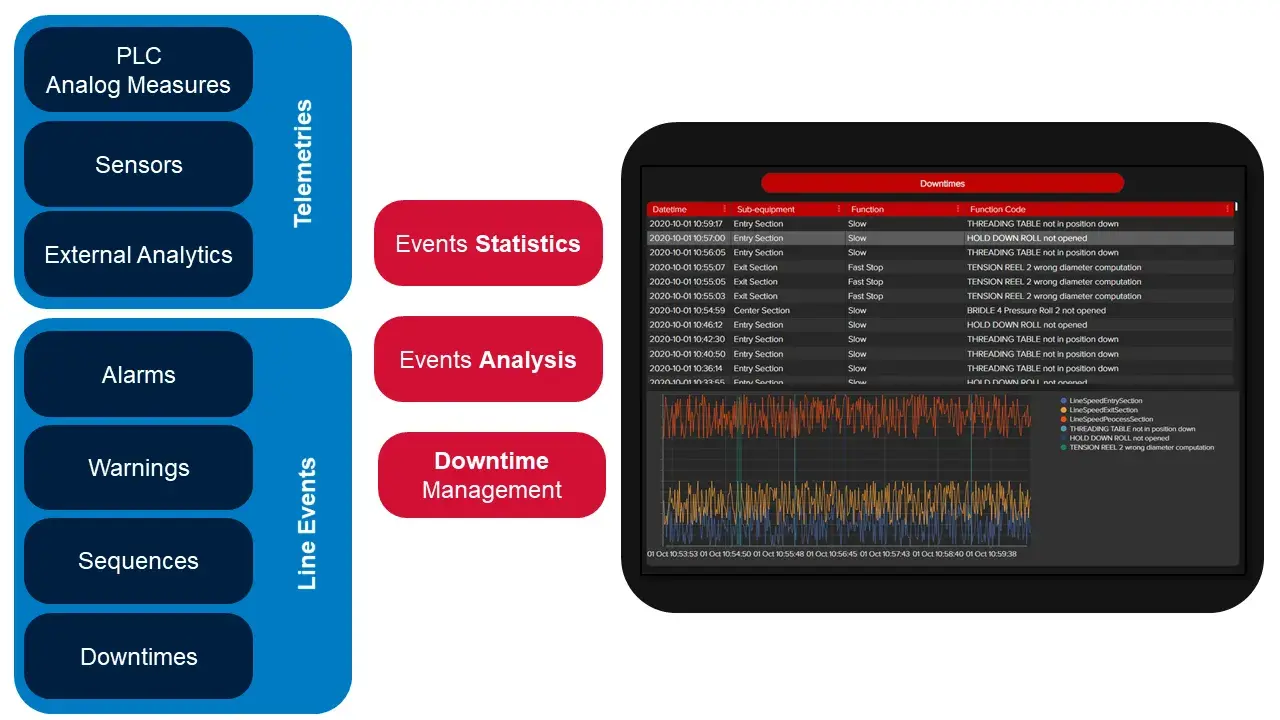
- Event statistics: multi-filtering tools to identify, generate statistics and sort out the most frequent plant anomalies.
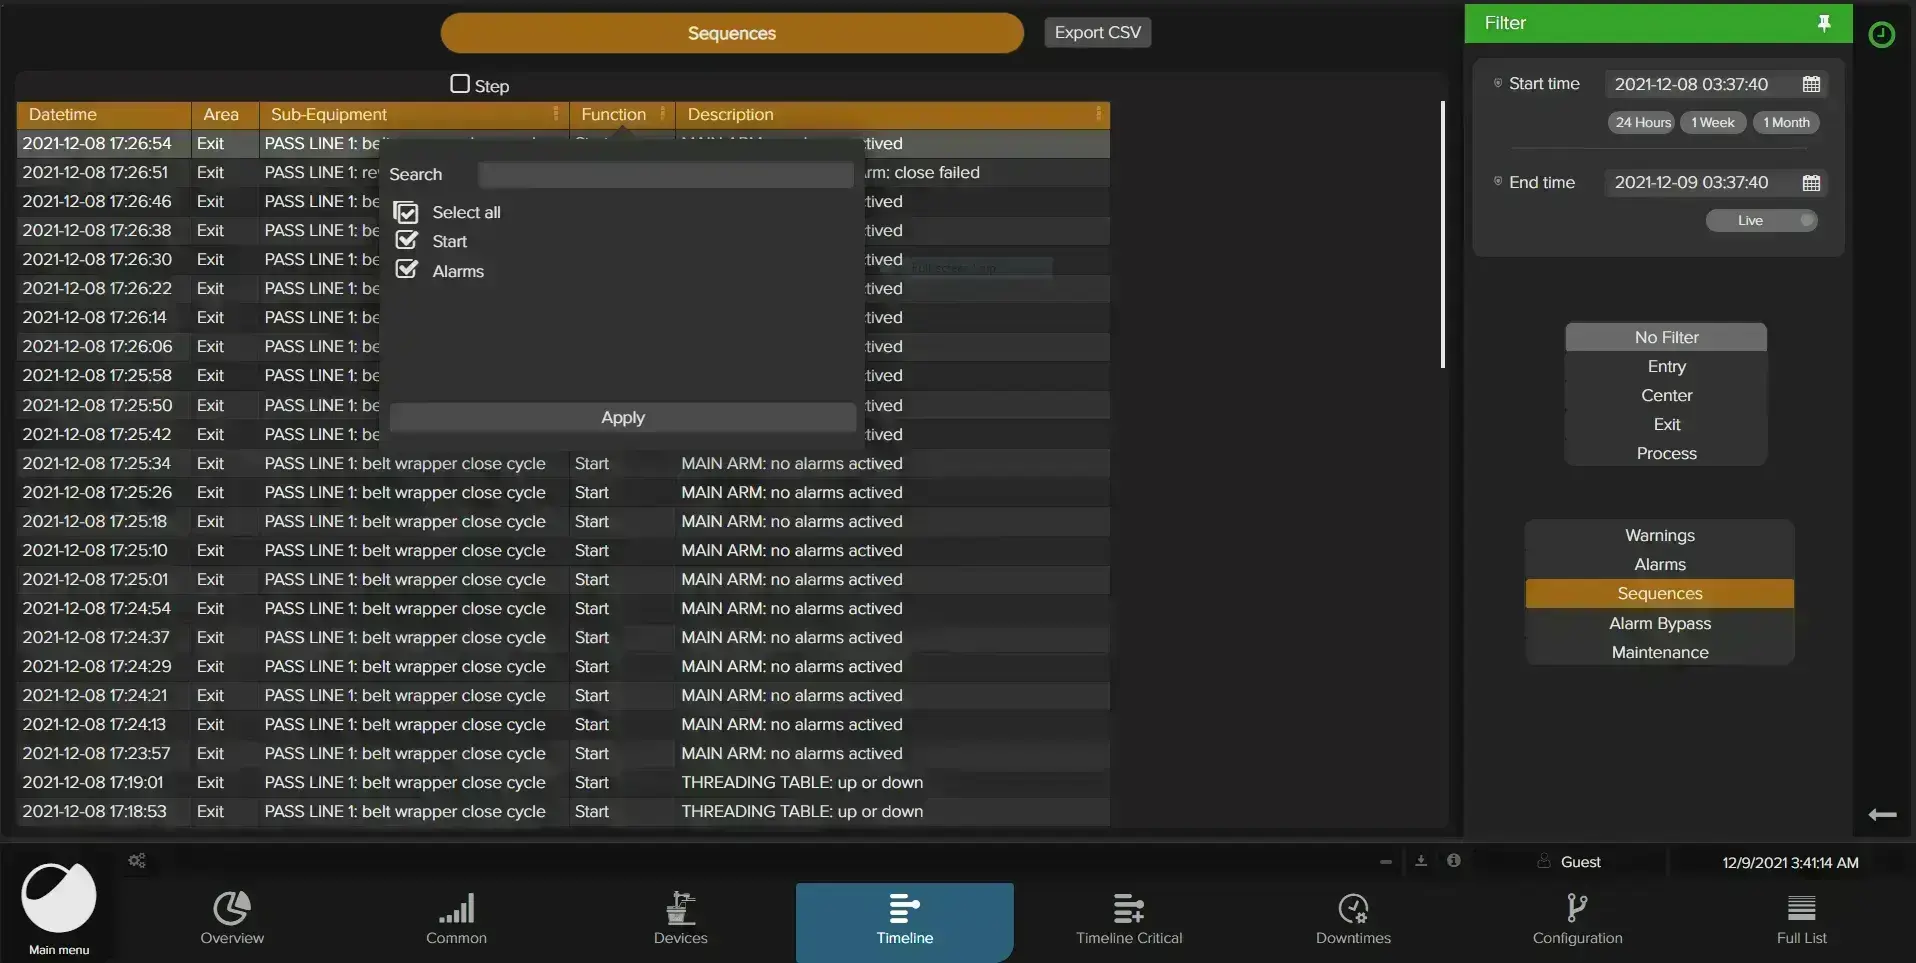
- Event analysis: correlation between events and telemetries to analyze or search for causes of anomalies;
- Downtime management: downtime reports; correlation of downtimes with other events and telemetries; annotations for downtime for future reference
The advantage is that this tool is completely integrated in the Tenova Automation package and does not require external software, related know how about its operation, nor additional licenses.
Technical data
Record Event Data (RED) is a tool developed by Tenova on the most up-to-date software technologies for time series analysis and data analytics.
Data can be acquired from any datasources in the field, such as plant PLCs, sensors, soft-sensors or output of other analyses.
In addition, RED supports the management of line events such as alarms, warnings, sequences or downtime thanks to a decoding layer that lets its application in different scenarios or existing plants.
The power of this system is that the type and number of data collected can be expanded at any time.
When applied to a Processing Line or to a Reheating Furnace the PLCs are the main sources where data are generated and therefore where information is drawn.
It is seamlessly integrated into an edge computing context, where most of the data analysis and storage is done directly on-premises.
RED uses a large amount of heterogeneous data to create easy-to-follow summaries through tables and graphs.
To achieve these results, data is stored in specialized state-of-the-art databases.
Telemetry measurements, usually analog signals, are stored in time-series databases, making it easy to search for high-frequency data over large periods of time.
On the other hand, events occurring on the plant are saved in document-oriented structures that allow the addition of metadata for classification without predefined schemas.
Algorithms and functionalities integrated in RED allow a correlation between data that facilitate the technician's investigation through a simple interface.
RED's core software is based on container-based technologies to ensure flexible deployment and continuous updating in connected environments.
In fact, thanks to the optional connection to the Tenova IIoT platform it will be able to provide more complete analysis services to support maintenance. RED provides useful information to reduce downtime and suggests optimizations in the processes used to operate the line, thus improving the quality of the final product.
Innovation
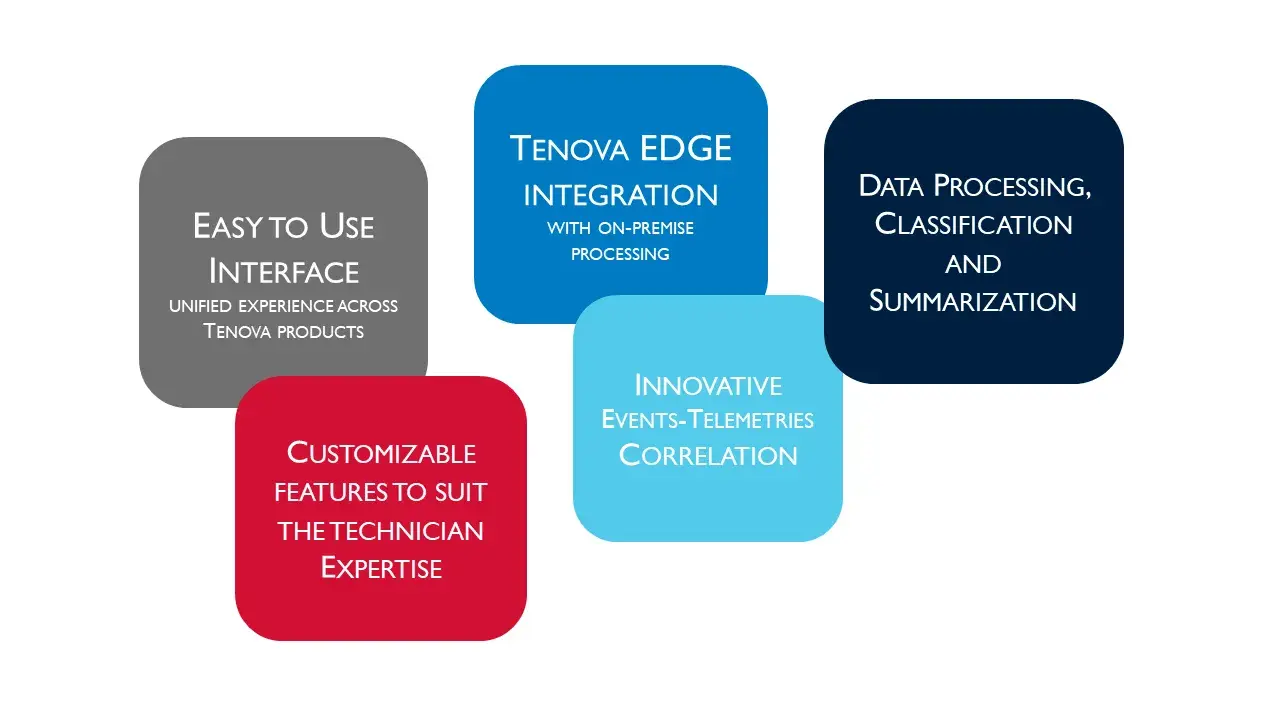
RED is an innovative solution for investigating the causes of plant anomalies.
The set of software technologies on which RED is based position it in the context of Industry 4.0 where large amounts of data are required to be processed and aggregated to provide simplified outputs for the end user.
In addition, optional data exchanges with Tenova's cloud platform allow for continuous feature updates and improved analytics.
RED works alongside -but does not replace- signal storage tools from the field. At the same time it introduces innovation in its ease of use and methodologies for processing, classifying and presenting aggregated data through simple interfaces that can be used by personnel with different levels of specialization and expertise.
Digital
The RED product is developed on the basis of the latest digital solutions employed by Tenova.
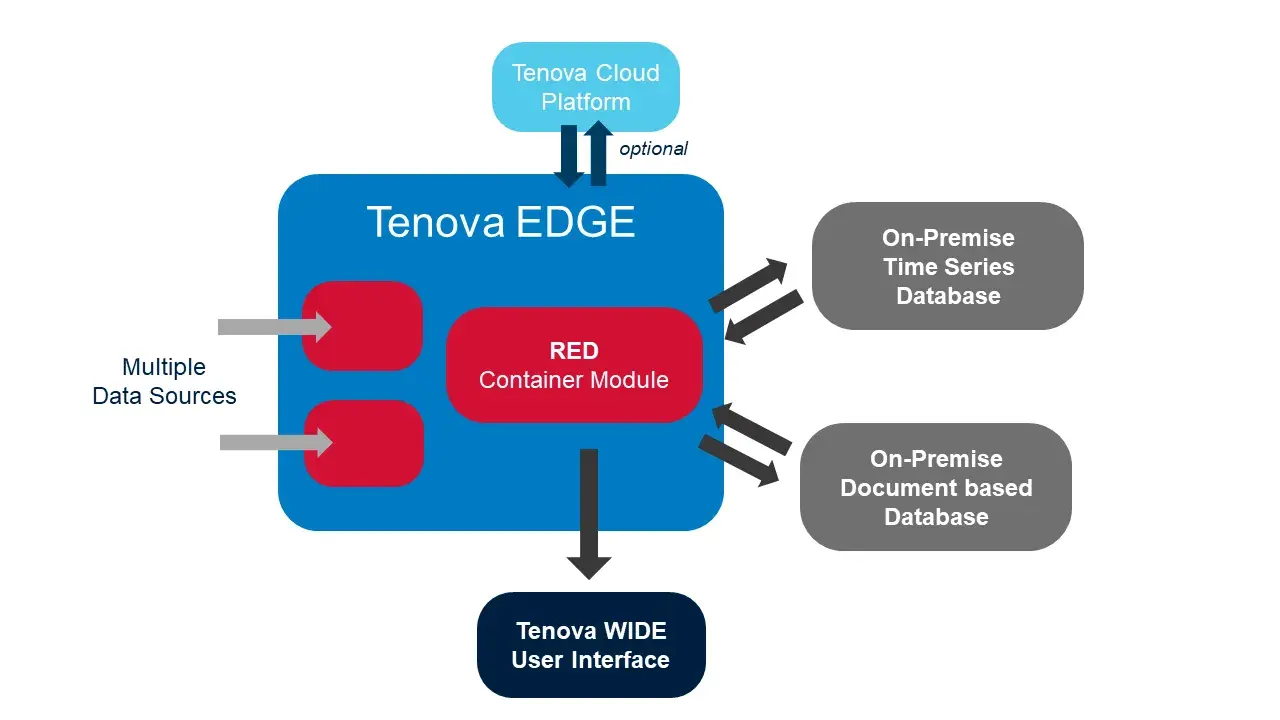
RED provides its best performed when deployed linked to the web services provided by the Tenova Platform.
Connection and cybersecurity are ensured by the Tenova Edge.
RED can be deployed as a module of Tenova Edge ensuring the customization required by the customer thanks to container-based technologies.
The graphical interface is based on Tenova WIDE delivering a unified user experience for the end user across multiple Tenova products.